Troubleshooting Workflows
Managing Workflow Errors and Logs
Even the best-built workflows occasionally run into errors, whether from missing data, API issues, or logic problems. Kinetic Platform provides clear and actionable visibility into these issues with multiple entry points for identifying, reviewing, and resolving errors.
This guide will help you understand where to find errors, how to resolve them, and how to track down more information through logs and workflow run history.
Where to Find Errors
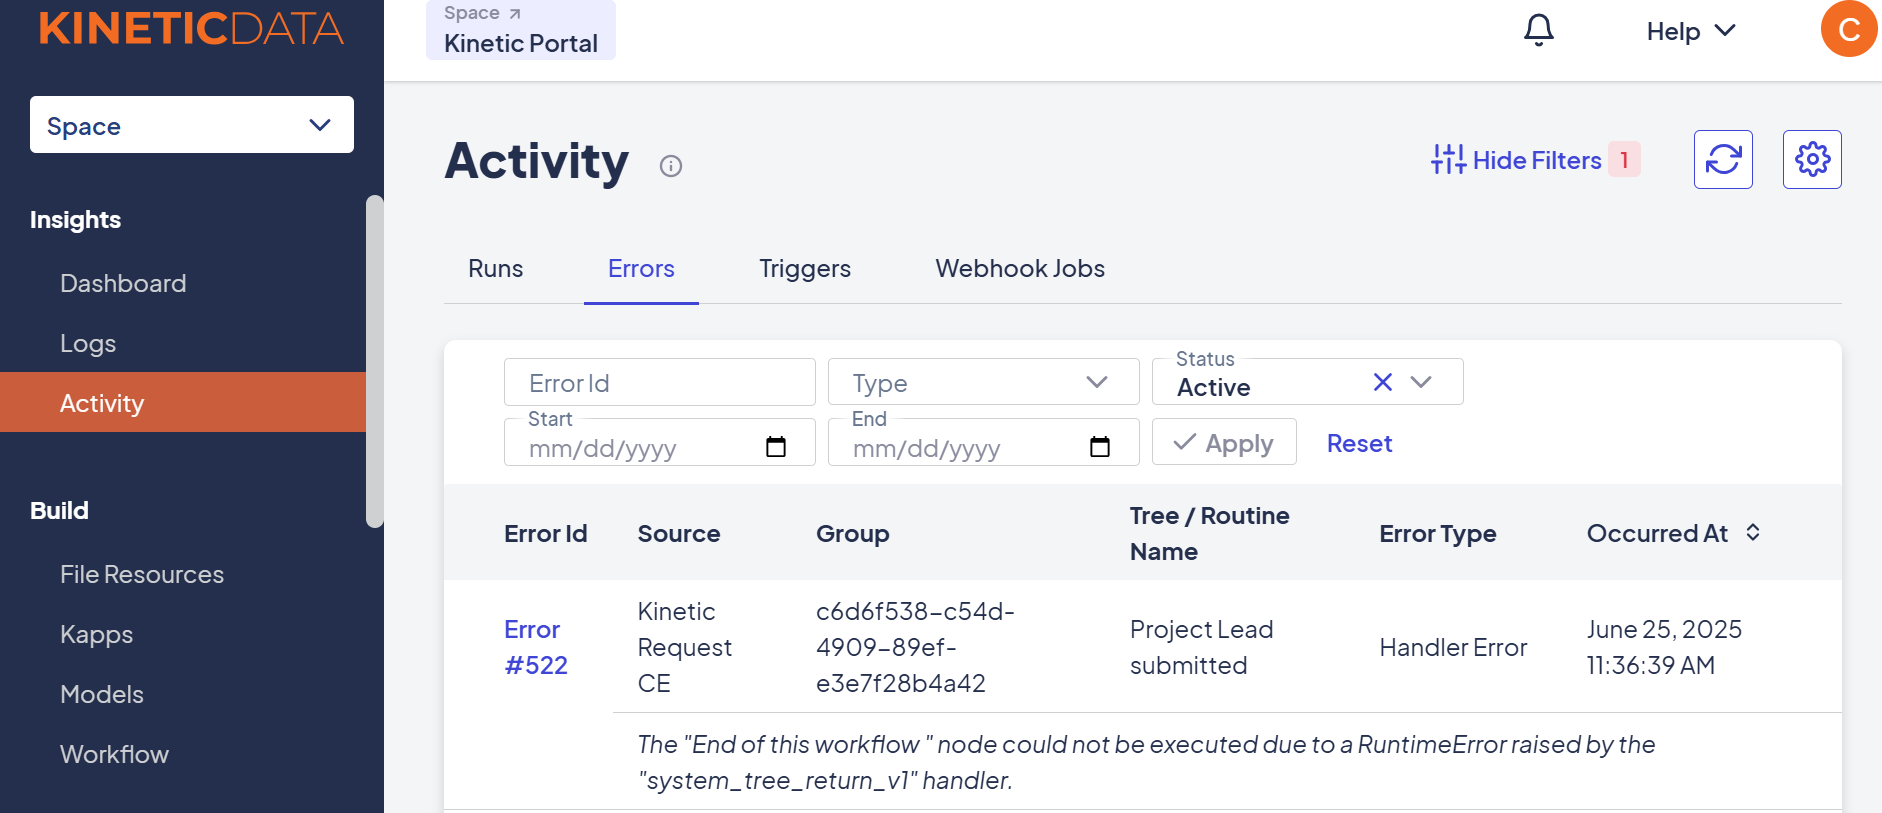
1. Activity > Errors (Space Console)
From the Space Console, navigate to Activity > Errors to view all current workflow issues across the platform.
- Each error includes: Error ID, Source, Name, Type (e.g., Handler, Connector), and Timestamp
- Clicking into the error brings up detailed context and retry options
- Filter or search by workflow name or error type for faster triage
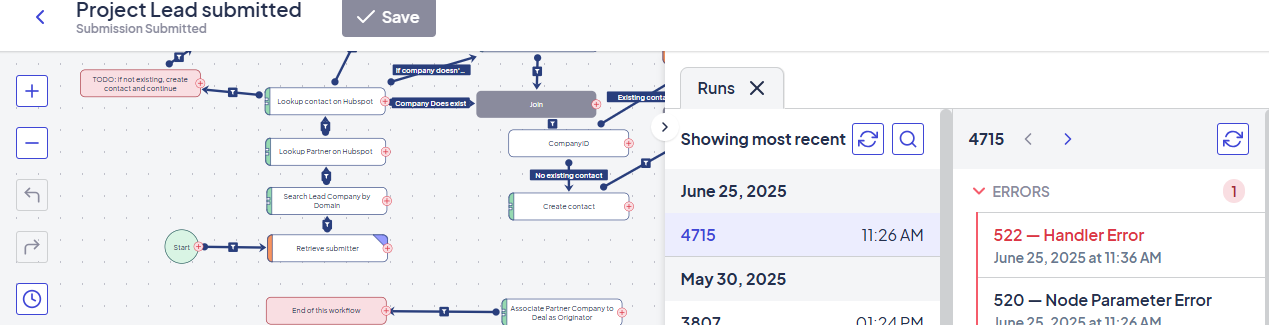
2. Inside the Workflow Builder
Open any workflow tree or routine and click the clock icon in the left-side menu. This opens the Run History panel from the right.
- See every workflow execution for the current tree
- Click into individual runs to inspect node-level activity
- Errors appear in red with details and retry options
- Great for debugging failed form submissions or integration issues
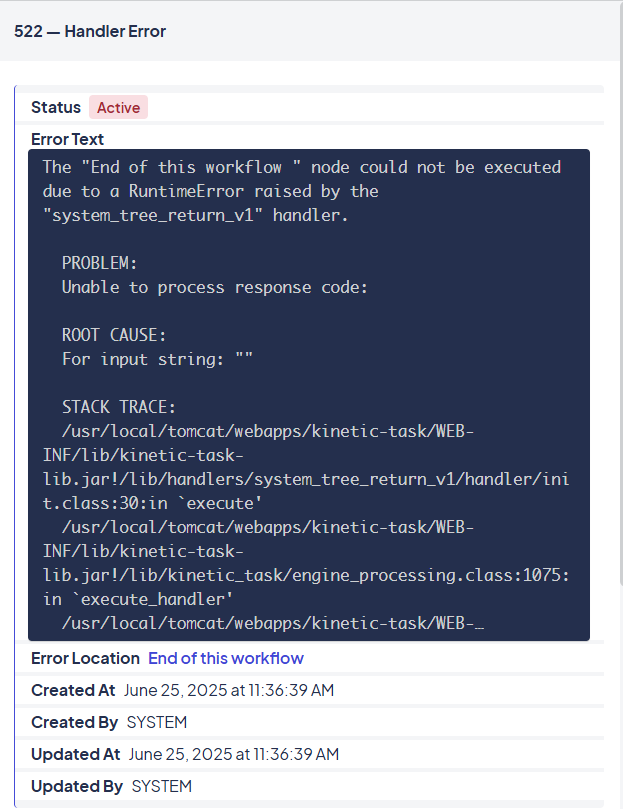
Understanding Errors
Clicking into an error brings up its detail view, which includes:
- The error message and stack trace (if applicable)
- A link to the run where the error occurred
- A button to Open in Builder, which highlights the failing node
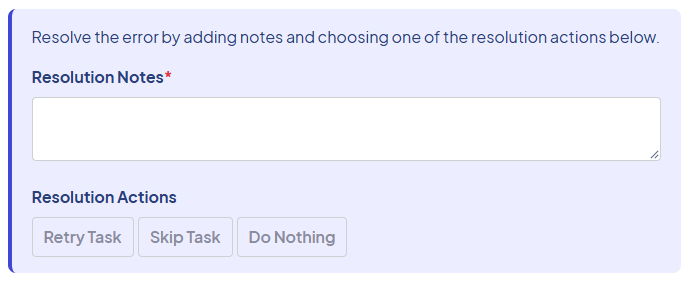
- A Resolution tab to apply retry or resolution actions
See an Example
Common Workflow Error Types
Unable to retrieve hash value for key
Unable to retrieve hash value for keyIt indicates that a reference to a node name is missing, incorrect, or hasn't been executed yet.
nil:NilClass
nil:NilClassThis error indicates that within either the handler code, or code in a node parameter, a method was called, but no value was provided.
For example, in your handler, you have the following code to convert a string variable to an integer x.to_i. If x is nil (null for ruby), you will get the nil:NilClass.
The stack trace will often show a line number in the init.rb file that relates to this error.
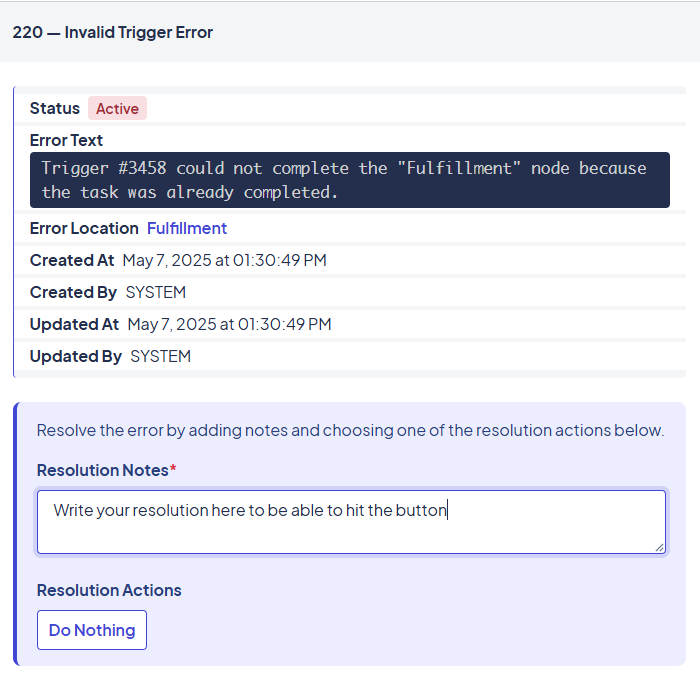
Invalid Trigger
This error occurs when a trigger attempts to complete a node that has already been completed.
In most cases, this happens with deferred nodes, such as approvals or wait steps, where you’re relying on a human or system action to send a completion trigger. If a second trigger arrives for the same node, even accidentally, the platform flags it as invalid.
Common Causes
- Duplicate triggers: Two systems or processes are sending the same completion trigger.
- Workflow misalignment: A deferred node was already completed by one path, but another part of the workflow also tries to complete it.
- Incorrect logic: A connector or handler sends a trigger too late, or after the node already moved forward.
Why It Matters
- The node has already moved on, so completing it again could create unexpected or invalid logic branches.
- Retrying this type of error is not possible, since the platform safely blocks double completions.
See an Example
SSLError
Usually indicates a handler connection issue — possibly due to:
- Untrusted SSL certificates
- Misconfigured handler settings
- Incomplete or incorrect environment setup
Resolving Errors
From the error detail screen or a workflow run, you can take the following resolution actions depending on the type of error:
Connector Errors
- Continue Branch – Treat the connector as if it evaluated to
true - Cancel Branch – Treat the connector as if it evaluated to
false
Node Errors
- Retry Task – Re-attempt node execution (caution: may duplicate actions)
- Skip Task – Skip the node and continue the workflow
Source Errors
- Retry – Restart processing from where it left off
Modifying Inputs or Results Before Retry
Sometimes an error isn’t due to a logic flaw. It's just a bad value that snuck through. Instead of rebuilding or restarting a workflow, you can edit the inputs or node results directly within the run to retry the workflow with corrected data.
This is especially useful for:
- Fixing user errors in form submissions
- Adjusting integration inputs
- Overriding failed logic for a one-time correction
Inputs
Inputs represent the data the workflow received when it was triggered, such as form answers, event metadata, or system values from the source.
You can edit inputs at the top of a Run record:
- Use this when a field was blank, incorrectly formatted, or missing.
- Once edited, click Retry Task or Run Again to reprocess with the new values.
Tip: Be sure to use the audit message to note why the input was changed.This helps with debugging and transparency later.
Results
Results are the outputs returned from a completed node, often used as inputs for subsequent steps in the workflow.
You can edit node results to:
- Fix data used in downstream logic (like connector qualifications)
- Simulate a successful outcome if an external system has already completed the action
- Force a specific branch of logic (e.g.,
"approval" = "yes") after resolving the issue manually
Note:
- You can only edit results after the node has run.
- This only affects future nodes — already-completed logic will not re-evaluate.
🔄 When to Modify Inputs or Results
| Scenario | Fix |
|---|---|
| User didn’t fill in required field | Edit the input |
| External API returned bad data | Edit node result |
| Need to bypass a step temporarily | Modify result to simulate completion |
| Wrong connector path triggered | Update result and retry connector |
🔁 What Errors Can Be Retried?
| Retry Type | ✅ Supported? |
|---|---|
| Handler Errors | ✅ Retry / Skip |
| Node Parameter Errors | ✅ Retry / Skip |
| Connector Errors | ✅ Continue / Cancel |
| Missing Routine/Handler | ✅ Retry / Skip |
| Source Errors | ✅ Retry |
| Invalid Trigger Error | ❌ Not retryable |
| Tree/System/Unknown | ❌ Not retryable |
Viewing Logs
Kinetic provides different levels of logging access depending on how your environment is hosted.
kinops Users (Hosted by Kinetic)
If you're using a kinops-hosted environment, you can view basic logs through the Space Console:
- Go to Space Console > Logs
- Access logs related to handler executions, connection errors, and platform-level workflow activity
Access is limited to the logs exposed in the UI.For deeper troubleshooting, reach out to Kinetic Support.
Customer-Managed Environments
Self-hosted customers have full access to logs via the System Console.
Go to Admin > Logs to access:
Available Logs
- Application Log – UI activity, builder usage, import/export errors
- Engine Log – Core workflow engine processing (rotates quickly on busy systems)
- Worker Logs – Downloadable logs for individual engine threads
- All Logs (Zip) – Full archive including Application, Engine, Install, and Environment reports
- Install Log – Tracks setup and initial config operations
Advanced Log Search (Requires Elasticsearch)
For advanced search and visualization across logs including tracing requests across systems or aggregating error patterns, you must configure Elasticsearch.
Ask your system administrator or refer to Kinetic's setup documentation to integrate Elasticsearch with your platform environment.
Log Level Settings
Modify log verbosity in your System Console under Admin > Setup > Log Settings:
Info– Best for productionDebug– Use in dev and staging environmentsTrace– Full detail for pinpoint troubleshooting (performance impact possible)
You can also adjust the total log file size retained. Be cautious with large log archives; they may slow down UI log viewing or downloads.
Summary
- Use Activity > Errors to monitor platform-wide workflow issues
- Use the Runs tab (clock icon in Builder) for context and retry options
- Apply resolution actions carefully. Check inputs before retrying
- Use logs for plugin and integration troubleshooting
What’s Next?
Updated 8 months ago